
Analysis of the company structure I
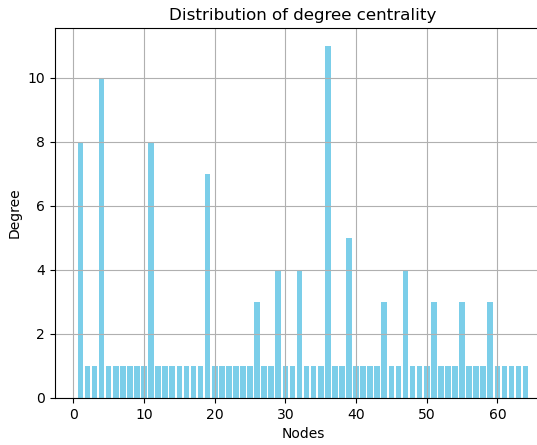
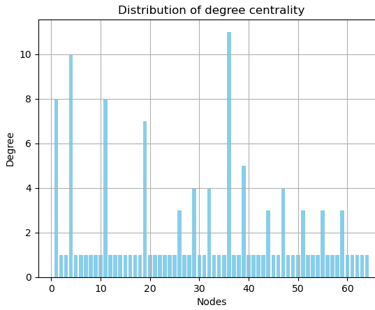
The graph illustrates the frequency distribution of node degrees (degree centrality) in the network.
Most nodes have a degree of 1, signifying that they are end nodes or leaves in the network, connected to the network through a single connection.
A smaller number of nodes have higher degrees, indicating central nodes with multiple connections.
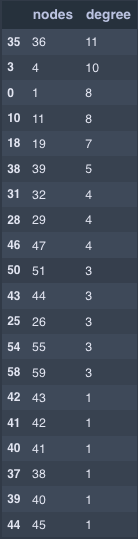

-> This distribution suggests a hierarchical or star-like structure where a few central nodes are key connectors (top-, mid- and low-level managers), and many nodes have limited connectivity (employees), likely indicating a top-down communication flow.
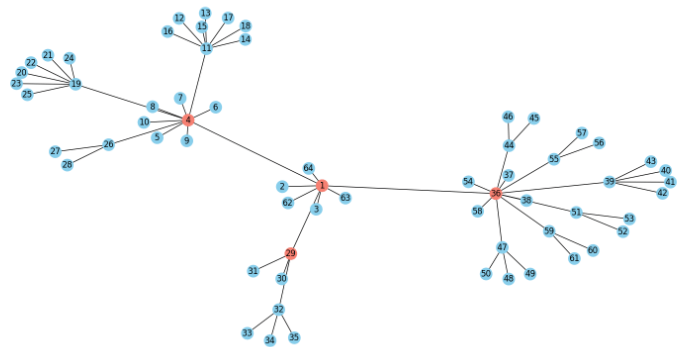
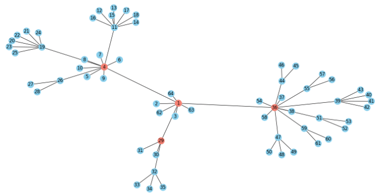
The network graph shows nodes (likely employees or departments) and edges (connections or relationships).
top - level manager are highlighted in red (Node 1, 4, 29 and 36) and have numerous connections, while peripheral nodes are in blue with fewer connections.
Node 36 and Node 4 are highly connected, serving as critical hubs within the network.
Surprisingly Node 29 (top-level management) only has the eighth highest degree, which means that the quantitative responsibility seams not to be equally distributed
Main goal: create a more balanced network to reduce dependency on top-level management and strengthen operational strategies.
Top-Level Management
Role: Strategic decision-making, overall leadership, and coordination.
Mid-Level Management
Role: Implementing strategies, managing teams, and facilitating communication between top and low levels.
Low-Level Management
Role: Direct supervision of employees, ensuring day-to-day operations run smoothly.
degree ≙ number of edges for every node
nodes ≙ position in the company
edges ≙ link between positions
2. Degree centrality
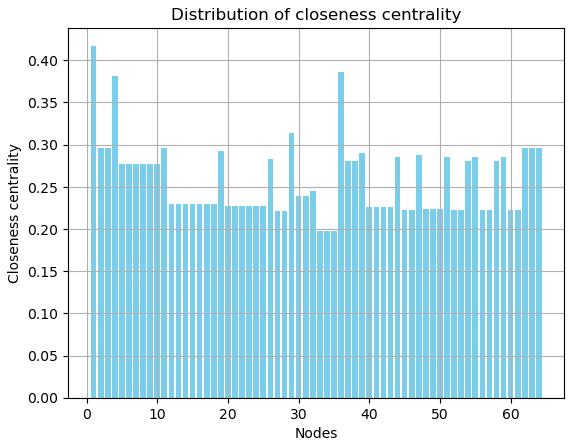
3. Closeness centrality

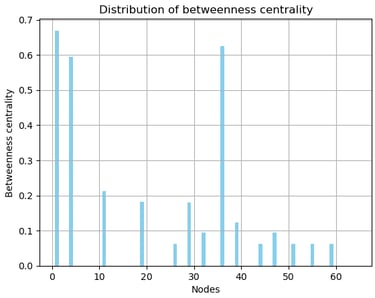
4. Betweenness centrality


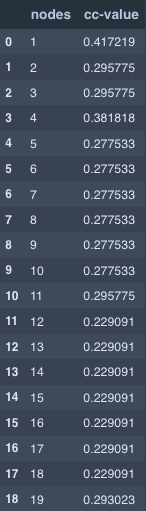
Node 1 (~0.42) and Node 36 (~0.39) have the highest closeness values.
→ These actors are centrally positioned in the network and can quickly communicate with many others. They could be crucial for coordination or rapid decision-making.
Nodes with low closeness values (e.g., Nodes 33–35, ~0.19) are peripheral.
→ These actors may operate at the edges of the organizational structure, such as specialized teams or employees with fewer internal interactions.
-> measures how close a node is to all other nodes in the network. It is calculated as the reciprocal of the sum of the shortest distances from a node to all others. Meaning in an organizational structure: Positions with closeness centrality are efficient in spreading information.
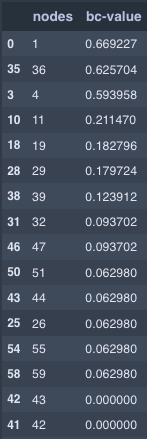
-> measures how often a node lies on the shortest paths between other nodes. It indicates the extent to which a node acts as a "mediator" or "bottleneck." Meaning in an organizational structure: Positions with a high betweenness centrality play a strategic intermediary role.
Node 1 (~0.67) and Node 36 (~0.63) have the highest betweenness values.
→ These actors are crucial for communication and collaboration. They act as bridges between different parts of the network. In an organization, they could be key managers or teams coordinating information across departments.Node 4 (~0.59) also has a high betweenness centrality.
→ This actor might be another intermediary who plays a role in important decision-making or resource exchange.Nodes with a betweenness of 0.0 (e.g., Nodes 2, 3, 5–10) have no intermediary role.
→ These actors may operate in a more direct and independent manner in their communication or work processes.
5. Analysis
Central Actors
The top-level managers (Nodes 1, 4, 29, and 36) play a crucial role in the network, with Nodes 36 and 4 standing out as key hubs. These nodes connect different areas and enable efficient communication. Nodes 1 and 36 have the highest closeness centrality values (~0.42 and ~0.39), indicating their central position in the network and their ability to interact quickly with many other actors. These nodes are essential for coordination and rapid decision-making.
Unequal Distribution of Responsibilities
Interestingly, Node 29, despite being in a leadership position, ranks only eighth in degree centrality. This suggests that the number of connections and, therefore, the responsibility within the network is not evenly distributed among the top managers. This could indicate that Node 29 is less actively involved in network communication or holds a specialized role with a narrower scope.
Mediator Roles and Information Flow
Nodes 1 and 36 also have the highest betweenness centrality values (~0.67 and ~0.63), highlighting their strategic importance as mediators and bridges between different parts of the network. They coordinate information flow and support collaboration across departments.
Node 4 (betweenness ~0.59) is another important intermediary, likely in an operational or tactical leadership position, playing a key role in decision-making or resource allocation.
Peripheral Actors
Nodes with low closeness centrality values (e.g., Nodes 33–35 with ~0.19) are positioned at the edges of the network. These actors have fewer connections and may operate in specialized or isolated roles, such as experts or teams with limited internal interaction.
Different Roles in the Network
High Degree Centrality but Low Betweenness (e.g., Node 11): Well-connected actors who do not serve as intermediaries. These nodes may be deeply embedded within specific teams or departments but do not act as bridges between different parts of the network.
High Closeness but Low Degree Centrality: Efficient communicators with few but strategically important connections, enabling them to quickly disseminate information.


6. Conclusion & Suggestions
Conclusion
The network reveals a clear hierarchy, with central actors like Nodes 1 and 36 facilitating information flow and collaboration. The unequal distribution of responsibilities among top managers (e.g., Node 29) may indicate potential areas for structural optimization. Peripheral nodes play supportive or specialized roles, while central nodes are critical for the network's efficiency and cohesion.
Suggestions
Strengthen Peripheral Connections
Issue: Peripheral nodes (e.g., Nodes 33–35) are isolated and have limited internal interaction.
Steps:
Encourage cross-departmental collaboration: Facilitate joint projects or task forces involving peripheral and central actors.
Knowledge-sharing platforms: Implement tools (e.g., Slack, Notion, Sharepoint) to enable peripheral nodes to share expertise and contribute more actively to organizational goals.
Balance Responsibility Among Top Managers
Issue: Uneven distribution of connections and responsibilities, such as Node 29's lower degree centrality.
Steps:
Redistribute responsibilities: Assign additional communication or decision-making roles to underutilized managers like Node 29 to better distribute the workload.
Enhance visibility: Ensure that Node 29 has more opportunities to connect with other nodes by assigning them to oversee cross-functional teams or strategic initiatives.
Regular reviews: Monitor network metrics to ensure an even distribution of connections among leadership roles.
Strengthen Mediator Roles
Issue: Nodes 1, 36, and 4 are heavily relied upon as intermediaries, creating potential bottlenecks.
Steps:
Develop backup hubs: Identify potential candidates among other nodes (e.g., those with moderate degree or closeness values) and train them to handle intermediary tasks.
Create redundancy: Assign additional mediators to key projects or processes to reduce dependency on a few critical nodes.
Mitigate Risks of Overdependence
Issue: Nodes 1 and 36 have high closeness and betweenness values, making them critical but vulnerable points of failure.
Steps:
Document knowledge and processes: Ensure critical information held by Nodes 1 and 36 is well-documented and accessible to others.
Decentralize decision-making: Empower more nodes with decision-making authority to ensure continuity in case of disruption.
Enhance Communication Efficiency
Issue: Some nodes (e.g., Nodes 11 or others with high degree but low betweenness) are well-connected but do not act as mediators.
Steps:
Incentivize collaboration: Recognize and reward efforts to connect disparate teams or departments.
Encourage broader collaboration: Promote these nodes to act as bridges across departments rather than operating only within their local networks.
Monitor and Optimize Network
Issue: Risks and inefficiencies may evolve over time.
Steps:
Conduct regular network analysis: Reassess metrics like degree, betweenness, and closeness centrality periodically to identify emerging risks or bottlenecks.
Implement feedback loops: Create mechanisms for employees to share challenges related to communication or collaboration.
Adapt roles and responsibilities: Reallocate tasks or introduce new processes to address weak points as they arise.
1. Company structure