
Report for ForestQuery into Global Deforestation 1990 - 2016
ForestQuery is on a mission to combat deforestation around the world and to raise awareness about this topic and its impact on the environment. The data analysis team at ForestQuery has obtained data from the World Bank that includes forest area and total land area by country and year from 1990 to 2016, as well as a table of countries and the regions to which they belong.
The data analysis team has used SQL to bring these tables together and to query them in an effort to find areas of concern as well as areas that present an opportunity to learn from successes.
1. GLOBAL SITUATION
According to the World Bank, the total forest area of the world was 41282694.9 sqkm in 1990. As of 2016, the most recent year for which data was available, that number had fallen to 39958245.9 sqkm, a loss of 1324449 sqkm, or 3.21%.
The forest area lost over this time period is slightly more than the entire land area of Peru listed for the year 2016 (which is 1279999.9891 sqkm).
2. REGIONAL OUTLOOK
In 2016, the percent of the total land area of the world designated as forest was 31.38%. The region with the highest relative forestation was Latin America & Caribbean, with 46.16%, and the region with the lowest relative forestation was Middle East & North Africa, with 2.07% forestation.
In 1990, the percent of the total land area of the world designated as forest was 32.42%. The region with the highest relative forestation was Latin America & Caribbean, with 51.03%, and the region with the lowest relative forestation was Middle East & North Africa, with 1.78% forestation.
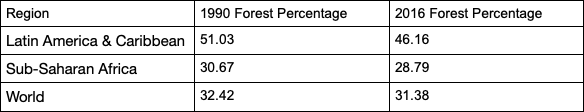

Table 2.1: Percent Forest Area by Region, 1990 & 2016
The only regions of the world that decreased in percent forest area from 1990 to 2016 were Latin America & Caribbean (dropped from 51.03% to 46.16%) and Sub-Saharan Africa (32.19% to 27.56%). All other regions actually increased in forest area over this time period. However, the drop in forest area in the two aforementioned regions was so large, the percent forest area of the world decreased over this time period from 32.42% to 31.38%.
3. COUNTRY-LEVEL DETAIL
A. SUCCESS STORIES
There is one particularly bright spot in the data at the country level, China. This country actually increased in forest area from 1990 to 2016 by 527229.062 sqkm. It would be interesting to study what has changed in this country over this time to drive this figure in the data higher. The country with the next largest increase in forest area from 1990 to 2016 was the United States, but it only saw an increase of 79200 sqkm, much lower than the figure for China.
China and United States are of course very large countries in total land area, so when we look at the largest percent change in forest area from 1990 to 2016, we aren’t surprised to find a much smaller country listed at the top. Iceland increased in forest area by 313.66% from 1990 to 2016.
B. LARGEST CONCERNS
Which countries are seeing deforestation to the largest degree? We can answer this question in two ways. First, we can look at the absolute square kilometre decrease in forest area from 1990 to 2016. The following 3 countries had the largest decrease in forest area over the time period under consideration:
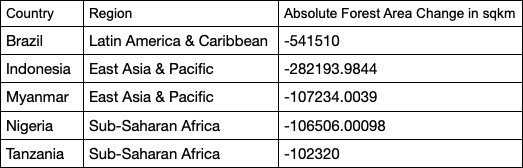

Table 3.1: Top 5 Amount Decrease in Forest Area by Country, 1990 & 2016
The second way to consider which countries are of concern is to analyze the data by percent decrease.
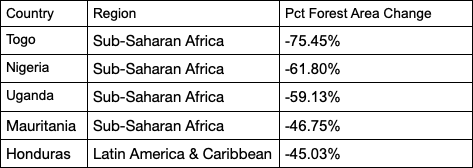
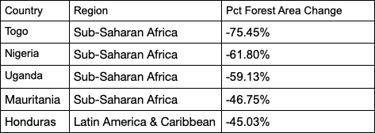
Table 3.2: Top 5 Percent Decrease in Forest Area by Country, 1990 & 2016
When we consider countries that decreased in forest area the most between 1990 and 2016, we find that four of the top 5 countries on the list are in the region of Sub-Saharan Africa. The countries are Togo, Nigeria, Uganda, and Mauritania. The 5th country on the list is Honduras, which is in the Latin America & Caribbean region.
From the above analysis, we see that Nigeria is the only country that ranks in the top 5 both in terms of absolute square kilometer decrease in forest as well as percent decrease in forest area from 1990 to 2016. Therefore, this country has a significant opportunity ahead to stop the decline and hopefully spearhead remedial efforts.
C. QUARTILES
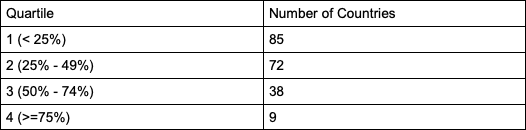
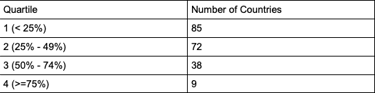
Table 3.3: Count of Countries Grouped by Forestation Percent Quartiles, 2016
The largest number of countries in 2016 were found in the 1 quartile.
There were 9 countries in the top quartile in 2016. These are countries with a very high percentage of their land area designated as forest. The following is a list of countries and their respective forest land, denoted as a percentage.
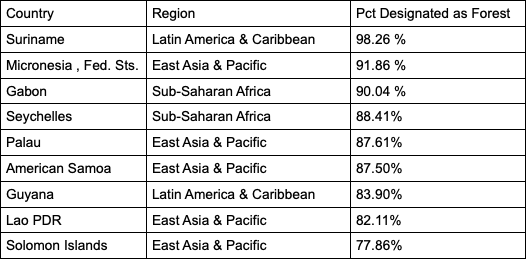
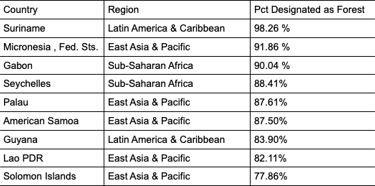
Table 3.4: Top Quartile Countries, 2016
4. RECOMMENDATIONS
From the data we received from the World Bank we learned, that there’re not only decreasing forest in the world. So some country already recognised how important the forest are for our ecosystem. In the same way we learned that it makes always a difference in how we look on the data. Sometimes everything might look not so bad when we see it in percentage but if we focus on the absolut amount of areas we will come to the conclusion, that the worldwide amount of decreasing forest area is really concerning. Thats why we need to focus on countries like Brazil wich lost 541.510 sqkm of their forest area. Especially in this case we need to consider that the rainforest in Brazil has a huge impact on climate balance and if we lose more of this area it will have a tremendous impact on climate change and for everyone on this planet.