
GoBike - Tripdata
Introduction
The Project 'GoBike - Tripdata' is divided into two parts:
The first part is about cleaning, filtering and analysing the dataset. The dataset 'fordgobike-tripdata.csv' contains 183412 entries on 16 columns. All entries can be divided in four different groups: Duration-Info, Start-Station-Info, End-Station-Info and User-Info. Every group contains numerical and categorical datatypes. The Exploratory Analysis is divided into the sections: Univariate-, Bivariate- and Multivariate Exploration, were we explore the dataset’s variables and understand the data’s structure, oddities, patterns and relationships.
In the second part it's necessary to generate some visualisations that are meaningful and easy understandable. During this part it's really important to catch the audience by telling a story about the Insights we've got.
Univariate Exploration
Question #1:
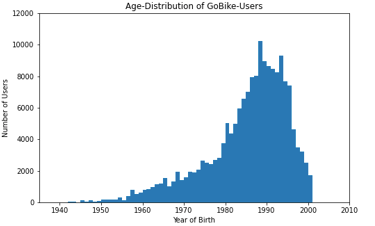
How is the age distribution of GoBike-Users?

Observation #1:
Here we can see a clearly left-skewed distribution. The majority of GoBike-Users was born in 1988. The youngest User was born in 2001 and the oldest 1943. In case if oldest users i dropped some entries because it seems a bit unrealistic that people with a age over 100 years use this kind of transportation.
Question #2:
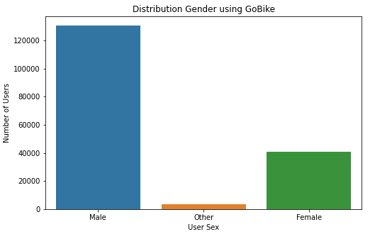
Does women prefer using GoBike than men?
Observation #2:
According to the chart above we can see that GoBike has way more male users than females and others. Unfortunately in this case isn't clear if other means diverse or that the person wont share their gender with us.

Question #3:
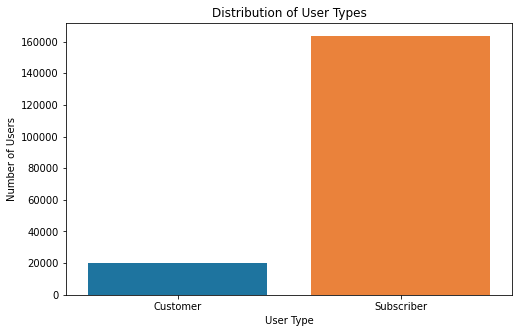
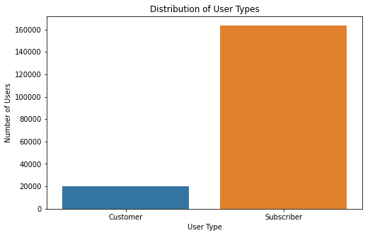
Does the number of customers exceed the number of subscribers?
Observation #3:
In the chart above we can see that GoBike has about eight times more subscribers than customers.
Question #4:
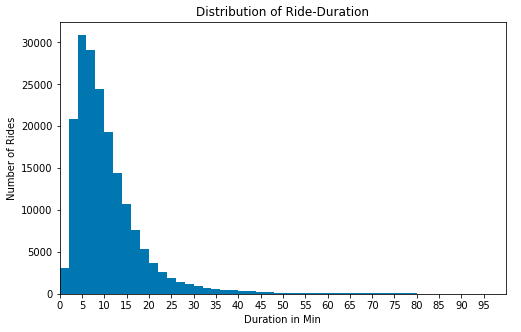
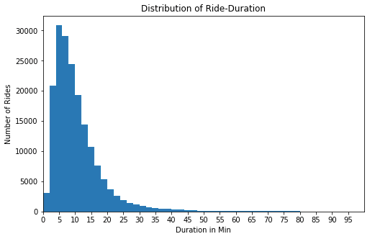
What is the most common duration of usage for GoBike-Users?
Observation #4:
In this right-skewed distribution we can see, that the highest number of Ride-Duration is about 4.5 min. The majority of Users takes a ride between 4 and 7 minutes. There're also some outliers, that a far beyond 90 minutes. The maximum value of Ride-Duration is 1424 minutes wich i clearly a mistake. Thats why i also didn't considered any values above 100min, because that seems very unusual for a ride by lend bike.
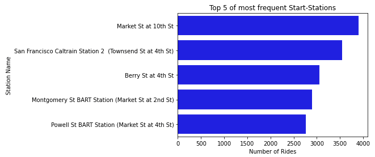
Question #5:
What are the Top 5 of most frequent Start-Stations?
Observation #5:
From the barplot we can see that position 1 'Market St at 10th Street' and position 2 'San Francisco Caltrain Station 2' differ clearly from each other. The last three positions are a bit closer together.

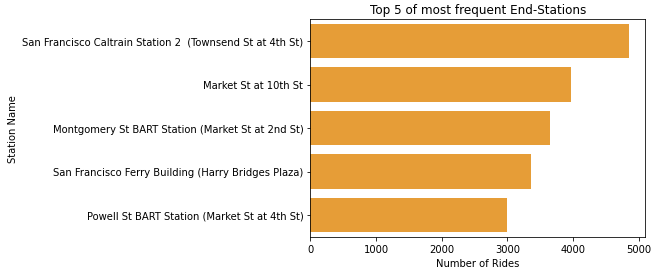
Question #6:
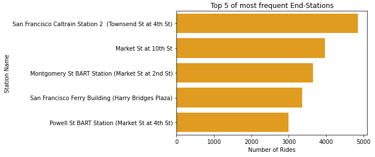
What are the Top 5 of most frequent End-Stations?
Observation #6:
From the barplot we can see that 'San Francisco Caltrain Station 2' on position 1 differs clearly from position 2 'Market St at 10th Street'. The last four positions have almost the same distance between each other. After analyzing the most frequent Start- and End-Stations i recognized that there the same stations in both rankings just with a slightly different order. That means that this places are very popular and maybe there not so many public-transport options between this spots. We can also see that these stations on position 1 and 2 act more often as End-Station wich means that these places are more popular as destinations.
Question #7:
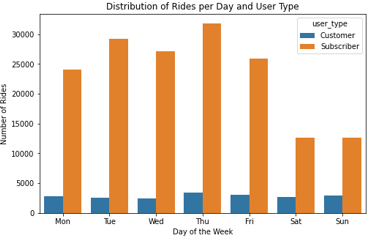
On what day GoBikes are used most frequent in a week?

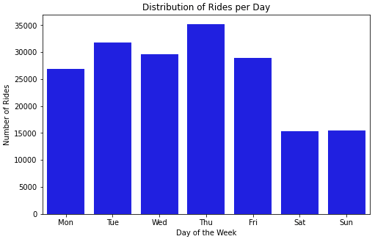
Observation #7:
In this graph we see that GoBikes are most frequently used during the week than on weekends what seems a bit surprising. First i assumed that they were more frequently used on weekends because of more freetime activity but in the plot we that the GoBikes were by more frequently used from Monday to Friday. On the Day of most frequent usage -Thursday- the Bikes were two times more frequently used than on weekend.
Question #8:
At what time GoBikes are most frequently used?

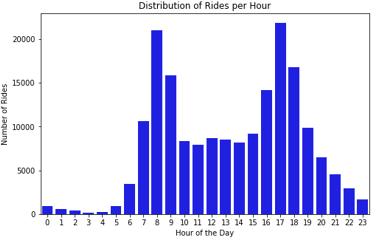
Observation #8:
In this visualization we see a multimodal distribution with two peaks at 8 and 17 o'clock. With considering the weekday distribution before we can now assume that mostly workers use the GoBikes for a ride to the working place and back home.
Bivariate Exploration
Question #9:
At what time does our subscribers use the GoBikes most frequently?
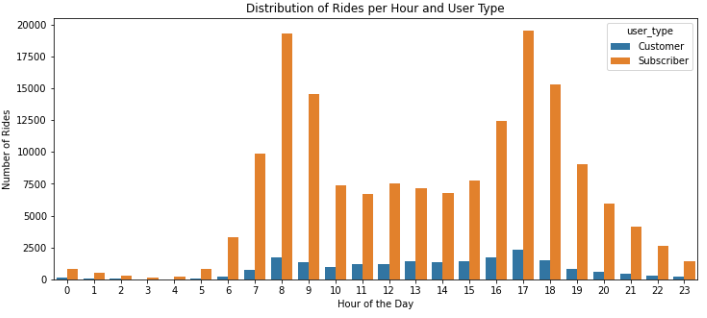

Observation #9:
Above we see a multimodal distribution for the GoBike-Subscribers, wich is very similar to the general distribution before. For the Pay-Per-Ride Customers we can also see a slightly multimodal distribution compared to the Subscribers. In conclusion it seems that there is no huge difference between the Customers and Subscribers in terms of relative distribution.
Question #10:
On what day of a week subscribers use GoBike most frequent?

Observation #10:
For the Subscribers we see a very similar distribution like before in the distribution of all User Types, with a more frequently usage on weekdays than on weekend. In case of Customers we have a slightly higher bar on thursday similar to Subscribers. The difference here is, that there isn't a decrease of GoBike usage on weekends.
Question #11:
What gender type is the majority in the group of our subscribers?

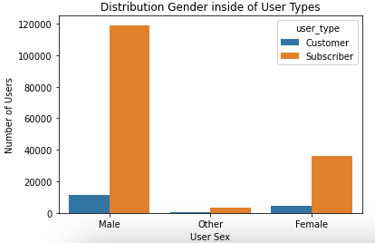
Observation #11:
From the barplot above we can see that, the relative distribution of gender in the user type section is almost the same. So we can assume that there is no preference for any gender when people decide to subscribe for GoBike.
Question #12:
How is the distribution of Ride-Duration for user types?
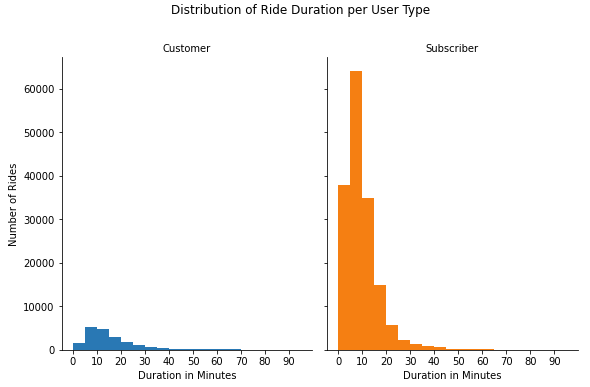
Observation #12:
According to the graphs above we can see that both distributions are roughly right-skewed. The main difference is that subscribers uses the bikes way more often for short term rides than customers.
Question #13:
How is the distribution of Ride-Duration for gender types?
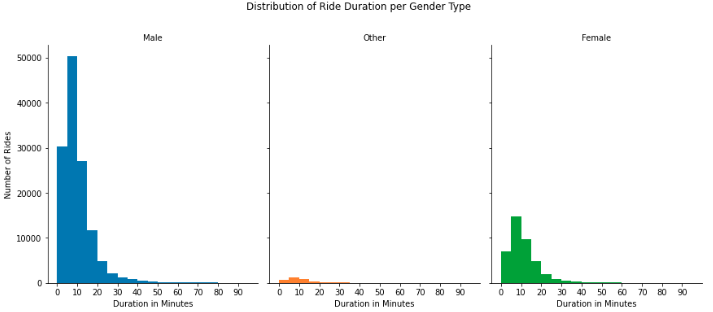
Observation #13:
As expected we see in this visualization of gender types a roughly right-skewed distribution in every plot related to the number of members.
Multivariate Exploration
Question #14:
What is the difference between subscribers and customers in terms of ride duration during the week?
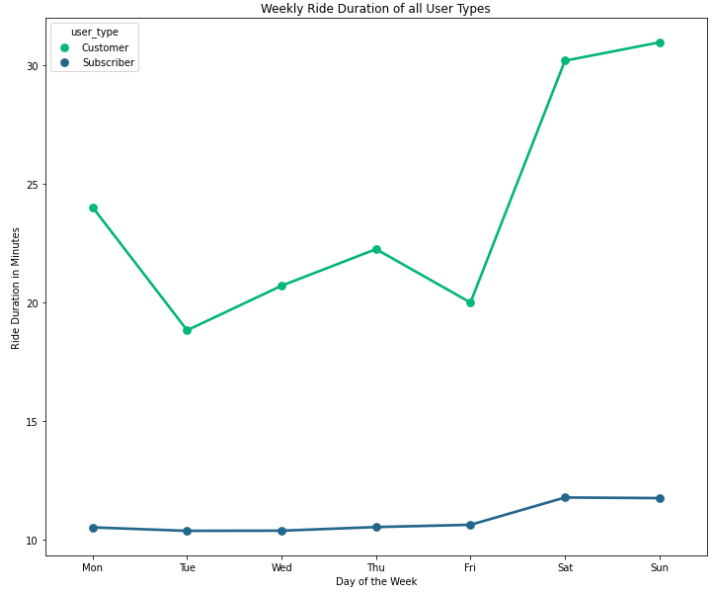
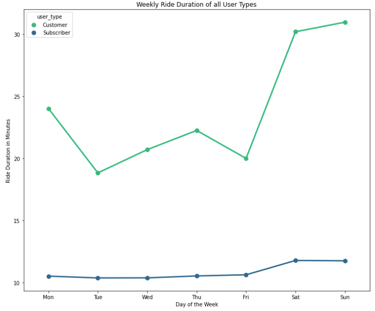
Observation #14:
In this pointplot we see a huge difference between the ride duration of customers and subscribers. The ride duration of customers is on weekdays roughly two times higher and on weekends three times higher than the duration for subscribers. Not forget to mention that both lines increases on weekend.
Question #15:
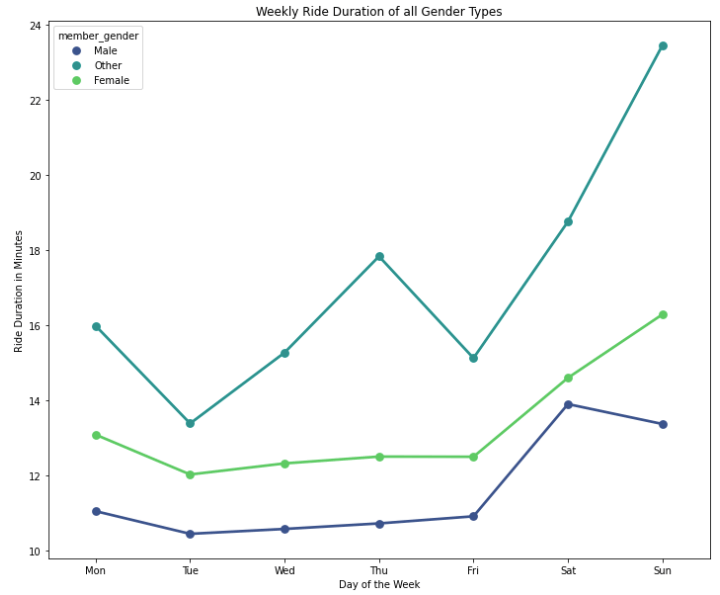
What is the difference between gender types in terms of ride duration during the week?
Observation #15:
In the pointplot above we see similarly like in the graph before a increasing duration on the weekend. But there some small differences if we go more to the detail. During the week there's a short drop of duration for all types. For females and males there follows a slightly increase until friday but for the Other-Type we see way more dynamic in in- and decrease of the duration. On weekend there is a rapid increase of duration for females and Other-Types but surprisingly not for males.
Conclusion
In the exploratory data analysis on the FordGoBike dataset i got many insights through the different types of variable exploration. In the first step of preliminary wrangling i started to get an overview about the data. Than i filtered the data and created a new dataframe with columns that were potentially interesting for further investigation. I also transformed some variables into different datatypes for calculation ans data extraction.
In the second step of univariate exploration i tried to get an rough overview by analyzing information about the users and their behaviour. Then i decided digging deeper to get a better understanding of what kind of persons the users are, how they behave in detail and maybe to assume what they want.
Through the bivariate exploration i started to dig deeper into detail of relationships between customers and subscribers for the purpose to be able to adjust the offer of GoBike's if it's not appropriate for their usage.
In the last step of multivariate exploration i wanted to know the differences of user and gender types while using the GoBikes. Therefore i created relationships between the duration of usage and days of the week and then i separated the different user and gender types from each other with surprising results.