Image Detection II - Electroluminescence (EL) image
Current Situation
The Problem
The Solution
In the production process of solar modules, the final visual inspection stage plays a critical role in ensuring the quality and performance of the product. One key tool used in this stage is Electroluminescence (EL) imaging, which allows manufacturers to identify defects that are not visible to the naked eye or through standard optical inspection methods. EL imaging helps detect various issues, such as shunts, dead cells, hotspots, and other production faults. Here's a detailed description of what happens during this process:
1.Purpose of EL Imaging
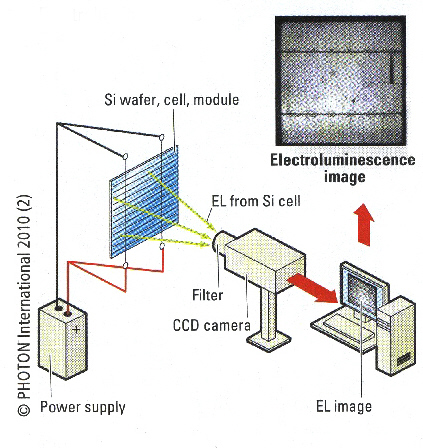
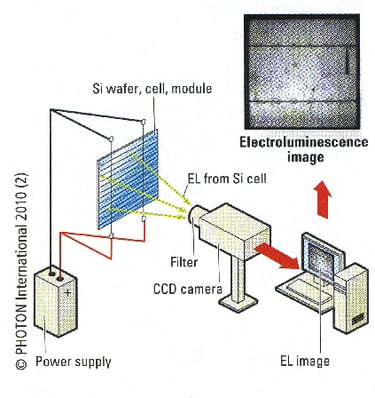
Functionality: EL imaging works by applying an electrical current to the solar module and capturing the resulting infrared light emitted by the cells. The intensity and uniformity of this emitted light reveal the electrical and structural integrity of the module.
Goal: To detect and classify production defects that could reduce the module's efficiency, longevity, or safety.
The use of Electroluminescence (EL) imaging as a quality control step in solar module production provides critical insights into structural and electrical defects. However, the reliance on human inspection for analyzing each module and image introduces significant challenges. Here’s a more detailed breakdown of the situation:
Using image detection and machine learning (ML) in Python, solar module defect detection can be automated with significantly improved speed and accuracy.


EL method, source
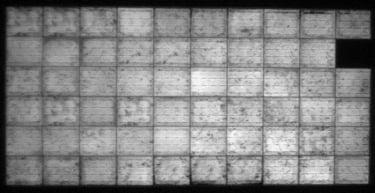
Dead cell, source
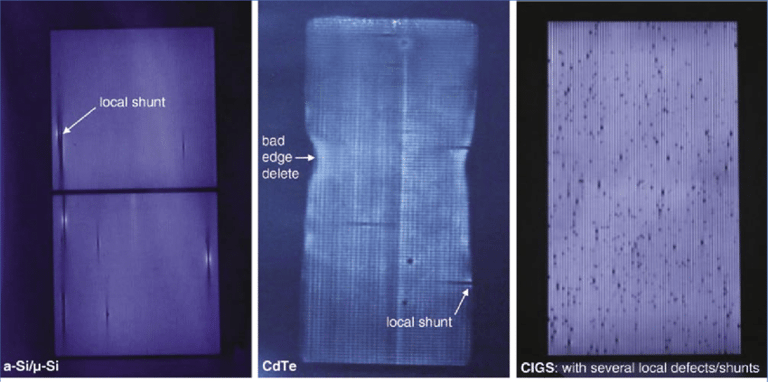
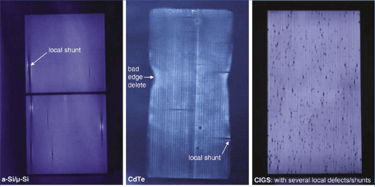
Shunt, source
2. Common Defects Detected
Shunts:
Areas where unintended electrical pathways allow current to bypass part of a cell. These show up as dark spots or regions in the EL image, indicating energy losses.Dead Cells:
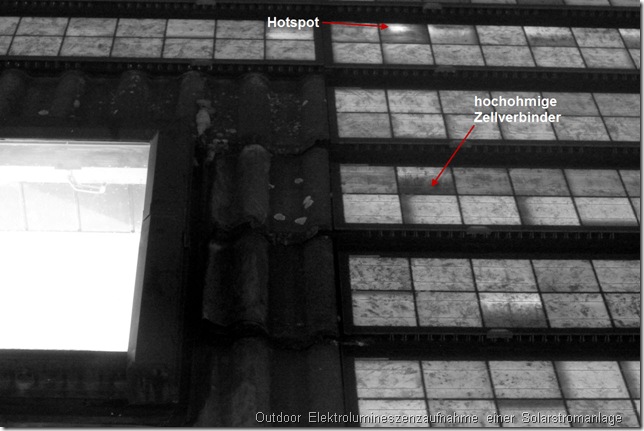
Entire cells that do not produce any power due to manufacturing defects or damage. These appear completely dark in the EL image.Hotspots:
Regions that heat up disproportionately under operation, potentially leading to thermal degradation. EL imaging reveals structural inconsistencies that might cause such hotspots.
Hotspot, source
3. Process Overview
After the module is assembled and laminated, it is subjected to EL imaging as part of its final quality inspection.
The module is placed in a dark environment, and a current is applied. A specialized EL camera captures high-resolution images of the module's emitted light.
The images are analyzed by automated software or quality control experts to identify and classify defects.
1. Manual Review of EL Images
Current Workflow:
Every solar module undergoes EL imaging as part of the final production stage. The resulting high-resolution images must be reviewed by human inspectors to identify and categorize defects such as shunts, dead cells, hotspots, and other irregularities.Challenges of Manual Inspection:
Human Error:
Inspectors may overlook subtle defects, particularly in complex patterns or when dealing with large batches of modules.
Fatigue and concentration lapses, especially during repetitive tasks, further increase the risk of missing critical faults.
Subjectivity:
Different inspectors might interpret the same defect differently, leading to inconsistencies in defect detection and classification.
Time-Intensive:
Reviewing hundreds or thousands of EL images daily is time-consuming, slowing down the production process and delaying shipments.
Resource-Intensive:
Requires a skilled workforce with specialized training to accurately interpret EL images, driving up labor costs.
2. Economic Impact
Increased Costs:
The need for highly trained human inspectors adds significant operational costs to the production process.
Manual inspection is a bottleneck that reduces overall production efficiency, leading to higher costs per module.
Quality Risks:
Missed defects due to human oversight can result in faulty modules being shipped to customers, leading to warranty claims, reputational damage, and potential financial losses.
False positives (marking a good module as defective) can lead to unnecessary rework or waste, further driving up costs.
3. Root Causes of the Problem
Large Volume of Data:
EL imaging produces detailed, high-resolution images for each module, generating an overwhelming volume of data that humans must analyze manually.Repetition and Complexity:
The repetitive nature of reviewing similar-looking images reduces focus over time, while the complexity of interpreting subtle defects requires sustained attention.Lack of Automation:
The industry heavily relies on human expertise, with limited integration of automated tools to assist or replace manual analysis.
1. Measuring Brightness for Each Cell
Image Preprocessing:
EL images of solar modules are processed to extract brightness information. Each solar module consists of multiple cells, and the brightness of each cell is measured as an indicator of its electrical performance.
Brightness measurements are often obtained using grayscale pixel intensity values. These values are normalized for consistency, ensuring that defects like dead cells or hotspots can be accurately identified.
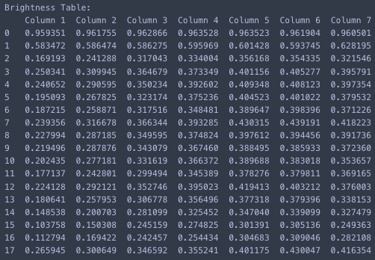
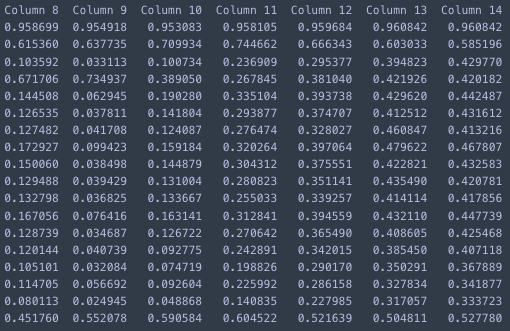
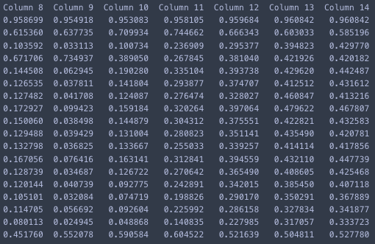
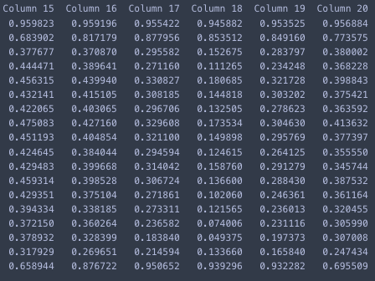
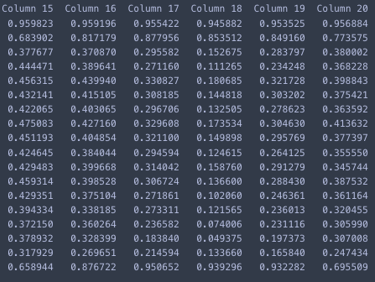
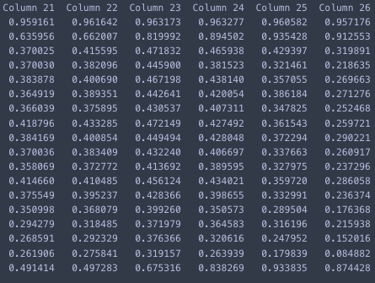
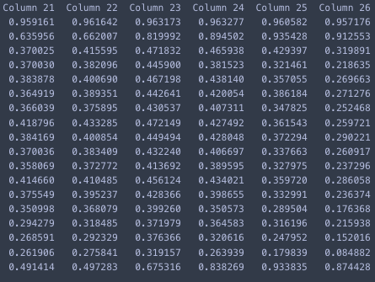
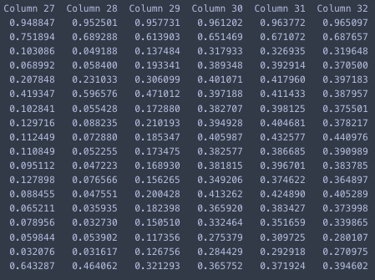
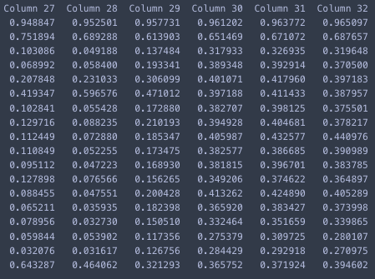
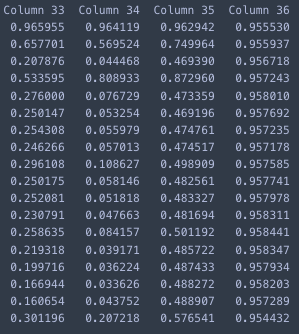
Storing Data in a DataFrame:
The brightness of each cell is recorded and structured in a pandas DataFrame. The DataFrame contains:
Cell Identifiers (e.g., row and column indices): To map the brightness data back to specific cells on the module.
Brightness Values: Numerical data representing the measured brightness for each cell.
Optionally, metadata such as module ID or timestamps can be included.
Example:
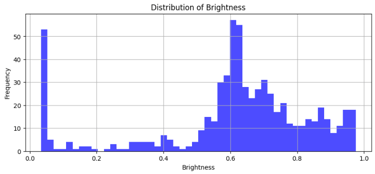
a. Brightness Distribution Graph
Purpose:
Shows the overall distribution of brightness values across all cells in the module.
Highlights anomalies such as outliers (e.g., extremely low brightness for dead cells or excessively high brightness for hotspots).
Implementation: A histogram or kernel density plot is created to visualize the brightness distribution.
Peaks in the graph indicate common brightness ranges.
Outliers or abnormal distributions can signal potential defects.
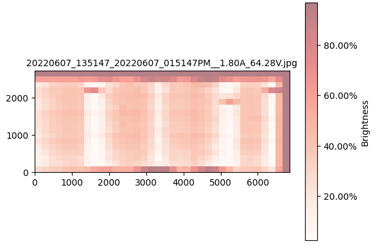
b. Color-Encoded Brightness Map
Purpose:
Provides a spatial representation of brightness values across the module.
Each cell is assigned a color based on its brightness, making defects easy to locate visually.
Implementation: A heatmap is created using libraries such as matplotlib or seaborn:
Cells with significantly lower brightness appear darker, while brighter cells are shown in warm colors.
This visual immediately highlights problematic areas such as hotspots (high brightness) or dead cells (low brightness).

2. Visualizing Brightness Data
To gain insights into brightness distribution and identify potential defects visually, two types of graphs are generated:
3. Insights from the Graphs
Brightness Distribution:
Normal cells typically fall within a predictable brightness range.
Deviations outside this range can be flagged for further inspection or labeled as defective.
Brightness Heatmap:
Spatial clustering of defects (e.g., multiple adjacent cells with low brightness) could indicate manufacturing issues or localized damage.
Randomly distributed defects might suggest external damage or inconsistencies in material quality.
4. Leveraging the Data for Machine Learning
Feature Engineering:
Use brightness values directly as features for an ML model.
Extract additional features such as:
Brightness variance across rows or columns.
Minimum and maximum brightness per module.
Clustering patterns of low-brightness cells.
Labeling the Data:
Annotate cells as "normal" or "defective" based on brightness thresholds or expert analysis.
Create a labeled dataset for supervised learning.
Model Training:
Train a classification model (e.g., Random Forest, SVM, or a CNN) to predict whether a cell is defective based on its brightness and spatial context.
Python libraries like scikit-learn, TensorFlow, or PyTorch can be used.
Real-Time Defect Detection:
Deploy the trained model to analyze brightness data and flag defective cells in real-time during production.
5. Advantages of This Approach
Efficiency:
Automating defect detection reduces time and labor costs compared to manual inspection.
Accuracy:
Machine learning models can detect subtle defects that might be missed by the human eye.
Scalability:
The system can handle increasing production volumes without a proportional increase in resources.
Data-Driven Insights:
Visualization tools and machine learning analysis provide actionable insights to optimize production processes and reduce defect rates.
This combination of brightness measurements, data visualization, and machine learning ensures a robust and precise system for solar module quality control.