
MSc Thesis - Visual Engineering
Part I - Data Preprocessing
The dataset was derived from a survey that was sent to participants via a web interface and subsequently completed by them. The responses were then exported into a CSV file.
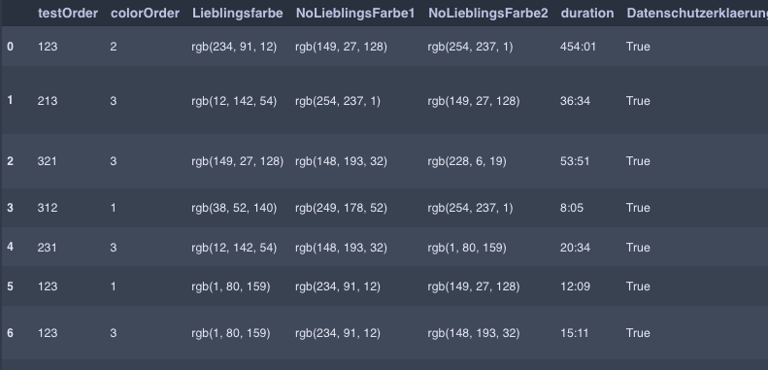
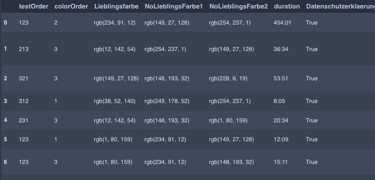
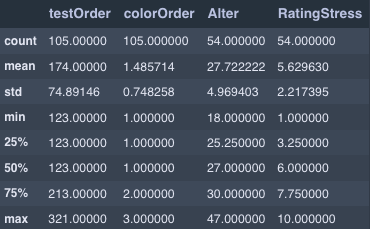
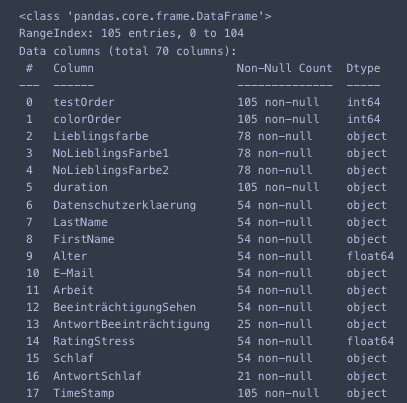
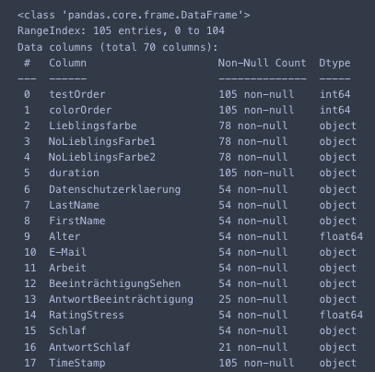
To inspect the data, it was first loaded into a pandas DataFrame. Various methods such as .info() or .describe() were applied to gain an initial overview of the quantity, shape, and structure of the data to be analyzed. To develop a better understanding of the dataset, it is also helpful to use .head(), .tail(), or .sample() - especially for datasets with a specific order to take a closer look at individual entries.
After these steps, initial challenges typical for such datasets often become apparent. In this case, entries that were either created for testing purposes, due to technical issues, or contained incorrect inputs from participants were identified and removed or corrected. It also became evident that the structure of the survey and database design generated a particularly high number of NaN values. To address this, some redundant columns were removed, and new columns were created in preparation for restructuring the dataset.
Once the entire dataset was restructured, the correct data types were assigned to the respective columns. With an eye on the upcoming analysis, columns containing free-text entries were categorized and consolidated. The remaining NaN values were replaced with appropriate values based on the theoretical background and the explanations provided in the dataset.
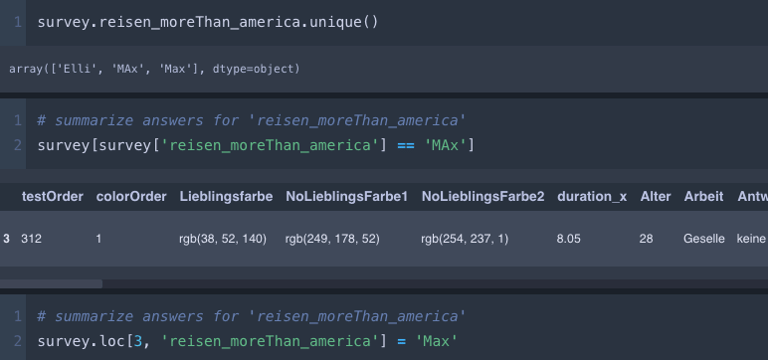
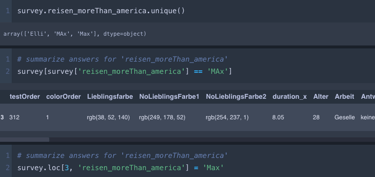
Throughout the preprocessing steps, the dataset was repeatedly checked to detect and prevent errors. The .value_counts() and .unique() method proved to be particularly useful for identifying problematic inputs.
"Auswirkungen der Farbpräferenz auf die Erinnerbarkeit von Informationsvisualisierung"
Disclaimer: i supported this master thesis with responsibility for all data related tasks. This includes the data preprocessing (ETL - extract, transform and load), data visualisation and evaluating the information for a final analysis. Since the work was written in German and I want to make the information accessible to a wider audience, I have translated the following sections into English
Part II - Data Visualization
Part III - Statistical T - tests
"Effects of Color Preference on the Memorability of Information Visualization"
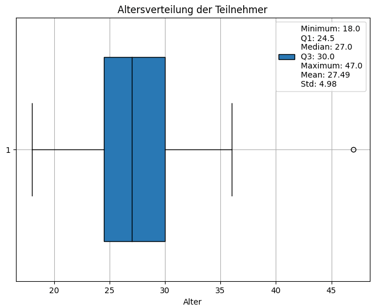


To gain a deeper understanding of the participants, a preliminary sociodemographic analysis was conducted. This analysis began with an examination of the age distribution, which revealed that the majority of participants were between 24 and 30 years old. This age range suggests a relatively young group, likely early in their professional careers or at a transitional stage between academia and the workforce.
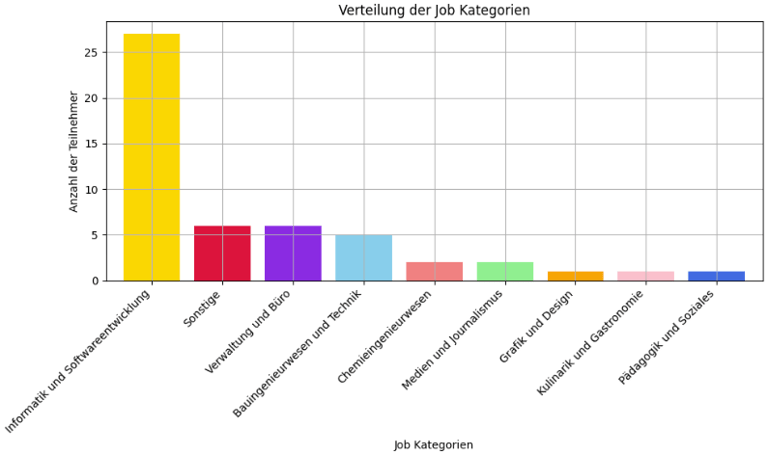
In addition to age, participants were asked about their profession or the industry in which they primarily work. It was particularly striking that more than 50% of the participants were employed in the fields of computer science and software development. This significant concentration highlights a strong representation of a specific professional demographic, potentially influencing the overall survey results due to shared experiences or challenges typical of these fields.
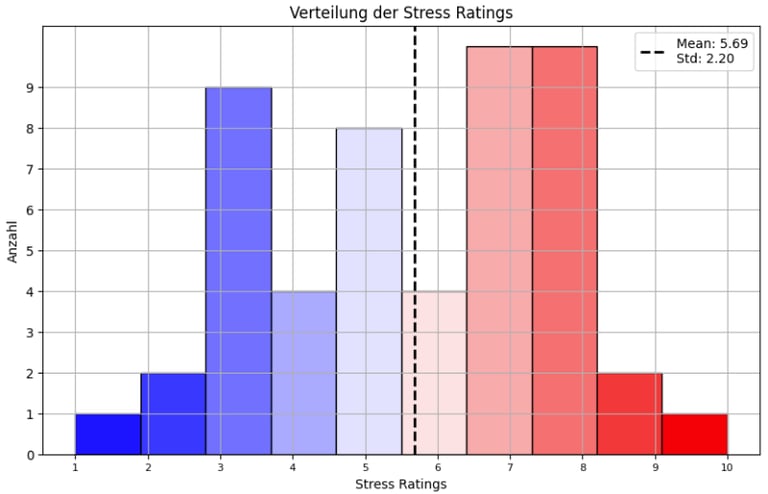
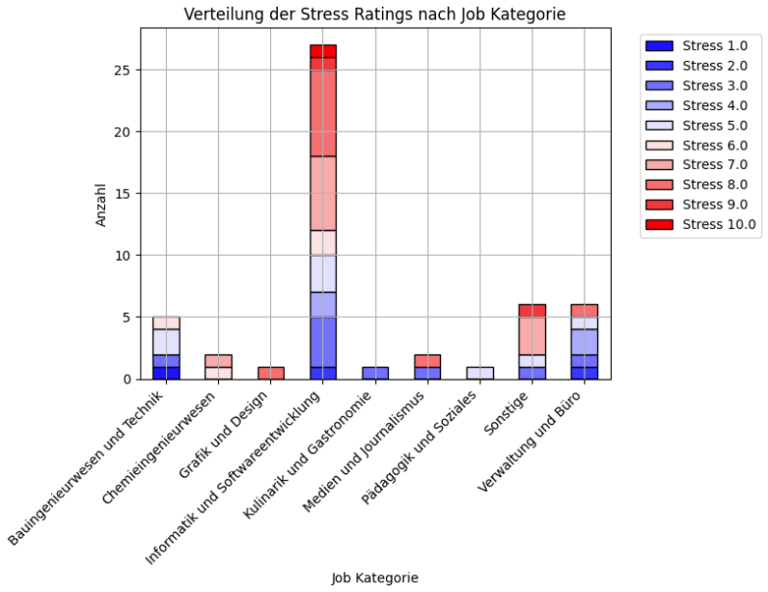
To contextualize the results of the survey and explore potential stress-related factors, participants were also asked to assess their current perceived stress levels. The findings, illustrated in a graphical representation, showed a multimodal distribution of stress. This means that participants generally fell into two distinct groups: one group reported feeling very stressed, while another reported feeling relatively relaxed.
In an effort to uncover the reasons behind this disparity, the stress ratings were further analyzed by grouping participants according to their job category. This deeper analysis revealed that over half of those working in computer science and software development reported experiencing above-average stress levels. This pattern suggests a possible link between the demands of this particular field and higher stress.
When these findings were combined with the age distribution and the context of the study—conducted as part of a master’s thesis—an additional layer of insight emerged. It is reasonable to infer that the majority of participants were likely students or recent graduates from the same academic program. Furthermore, the timing of the survey appeared to coincide with a period of heightened academic activity, such as exams, deadlines for assignments, or thesis work, which likely contributed to elevated stress levels.
This combination of factors—professional background, age, and academic pressures—provides a clearer picture of the participants’ experiences and stresses during the survey period. These insights are crucial for interpreting the overall results within their broader context.
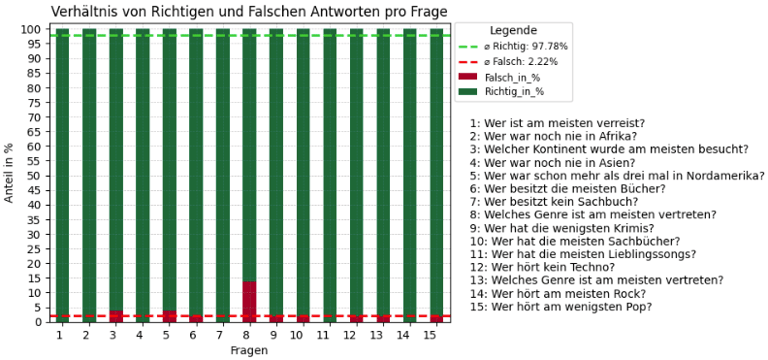
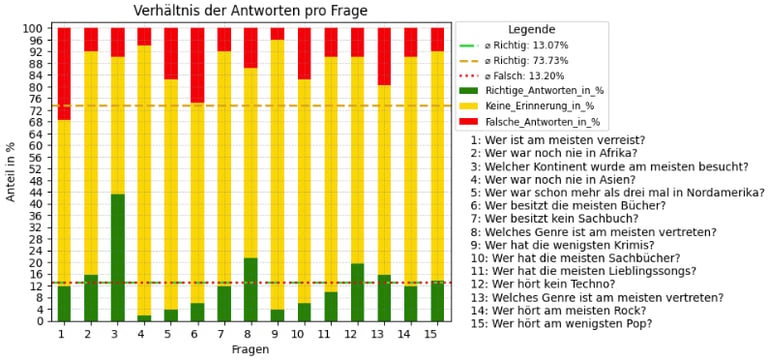
In the second phase of the visual analysis, the focus shifted to comparing the responses from the first and second rounds of the survey. In the first part, participants were presented with a series of graphs in various colors and were tasked with interpreting the information displayed in these graphs to answer a set of questions. A notable trend emerged, as highlighted in the bar chart: Question 8 stood out due to a disproportionately high rate of errors. Participants frequently either misinterpreted the graph or provided incorrect answers, indicating a potential issue with either the graph's design, the clarity of the question, or the participants' understanding of the task.
The second part of the survey, conducted two weeks later, was designed to assess participants' ability to recall the questions and their answers from the first round. The primary aim of this phase was to investigate whether the color coding of the graphs in the first part had any measurable impact on participants' ability to retain and retrieve the information. The results, as illustrated in the bar chart, were highly diverse. Participants' responses in this phase ranged from correct recollections to incorrect recollections, as well as a significant proportion of cases where participants reported having no memory at all of the relevant information.
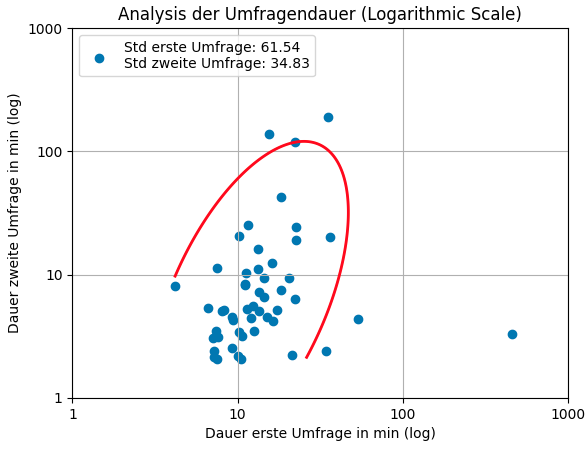
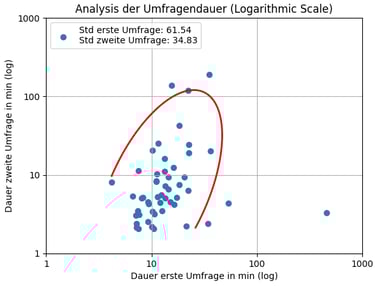
To better understand these results, the time taken by participants to complete both parts of the survey was analyzed. This analysis sought to identify whether participants faced challenges during the tests, such as difficulties in interpreting the graphs or recalling the answers. Interestingly, the data revealed that participants took less time on average to complete the second part of the survey. This finding initially appeared counterintuitive, as the process of recalling information is generally expected to take longer than simply reading data from a graph.
However, upon closer examination of the responses in the second phase, it became evident that nearly two-thirds of the answers in this phase involved no recollection at all. This suggests that many participants either skipped the recall attempt or provided very quick responses without attempting to engage deeply with their memory. This lack of recollection likely contributed to the overall time savings during the second part of the survey.
Nonetheless, a deeper examination revealed that certain questions showed a higher-than-average rate of both correct and incorrect recollections. This suggests that some questions or graphs from the first part were either particularly memorable or especially prone to misinterpretation in the recall phase. To determine whether these observed differences are statistically significant, a T-test will be performed in the next stage of the analysis. This test will provide a clearer understanding of whether the variation in recall accuracy, especially for specific questions, is meaningful or due to random chance.

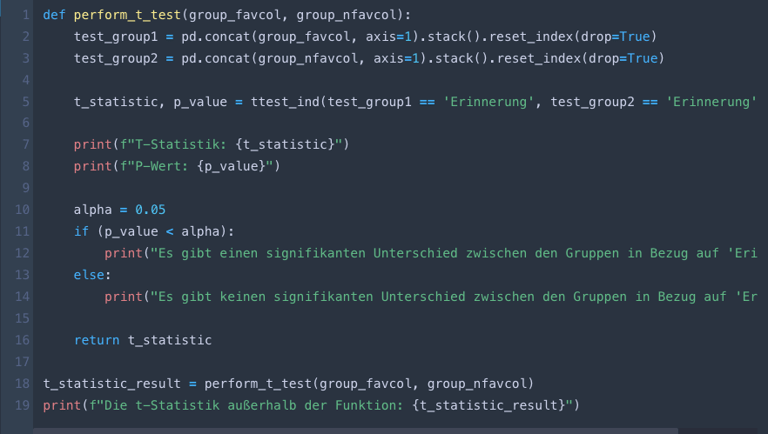
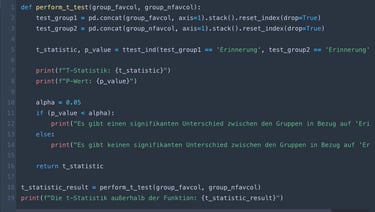
For the t-test, a null hypothesis (H₀) was initially formulated, stating that memory recall is not influenced by color coding. The goal was to test this hypothesis against the alternative hypothesis (H₁), which claims that color coding does have an impact on memory recall. Subsequently, the tolerance level (α) was set at 0.05. The responses were then categorized based on whether or not participants demonstrated memory recall. In the next step, the responses were divided into two groups to identify differences between them: one group used the participant’s favorite color in the second part of the survey, while the other group did not.
Interpretation:
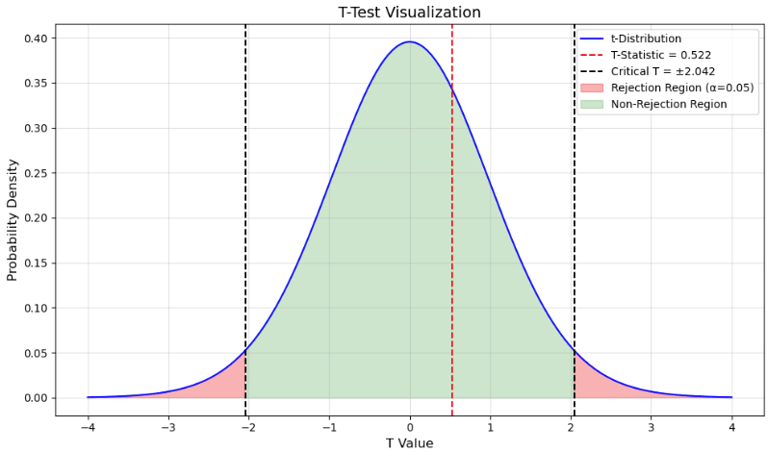
The p-value obtained from this t-test is 0.6016885763061222. Since this p-value exceeds the predefined significance level of α = 0.05, there is insufficient evidence to reject the null hypothesis.
Conclusion:
Considering the significance level of 0.05, we cannot conclude that the color coding of the graphs has a significant effect on memory recall. The results support the null hypothesis, and there is no statistically significant evidence to suggest that color coding impacts memory recall.
The t-statistic of 0.5221914911798826 indicates that the mean values for group 1 (graphs using the favorite color) are slightly higher than those for group 2 (graphs without the favorite color). However, due to the high p-value, this observed difference is not statistically significant.
Limitations and Considerations for Test Validity
The validity of the test, which unfortunately failed to confirm the alternative hypothesis (H₁), can still be questioned for the following reasons:
Lack of an incentive system: Without a reward mechanism for the participants, it is likely that many, especially during the second part of the test, did not make a genuine effort to recall the information. Instead, they may have rushed through the test simply to finish it quickly.
Poor participant diversity: The majority of participants came from the same academic program or field of study and belonged to a similar age group. This lack of diversity limits the generalizability of the results to a broader population.
High levels of pre-existing stress: Stress, which was clearly evident during the survey, along with possible sleep deprivation, may have significantly impaired participants' memory performance, adding noise to the results.
Small sample size: With only n = 54 participants, the sample size is not sufficient to draw meaningful conclusions for a significantly larger population.
Short-notice test design: The test was designed on short notice, which may have unintentionally introduced errors. These errors could have led to misunderstandings or even suggestions that influenced participants' responses.
By addressing these limitations, future studies could produce more reliable and robust results.