
Outlier analysis in PV monitoring
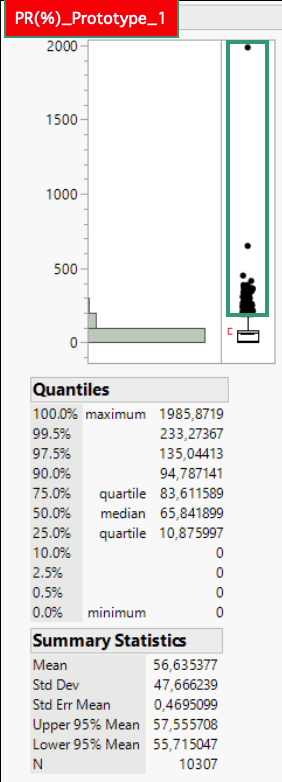
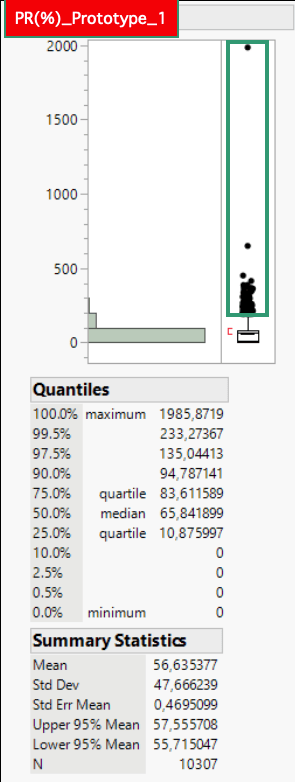
PR in % Prototype 1
expected PR‘s between 0 – 100% ±10% StD from uncertainties
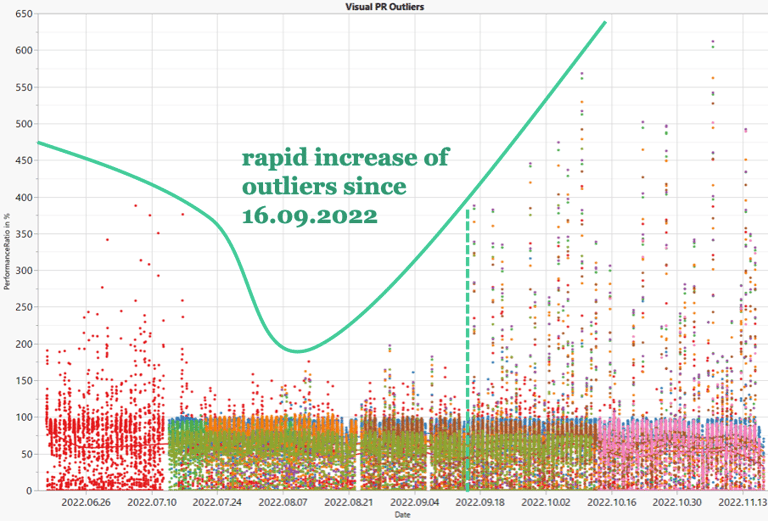
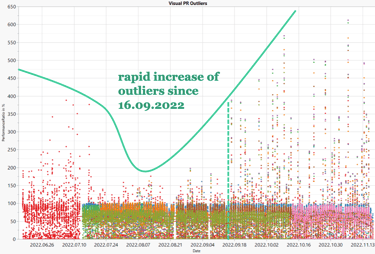
During the analysis of the data from PV outdoor monitoring a rapid increase of uncertanties in the measurement was recognized
The Problem
l. Approach: detailed examination of measurements


Central Tendency:
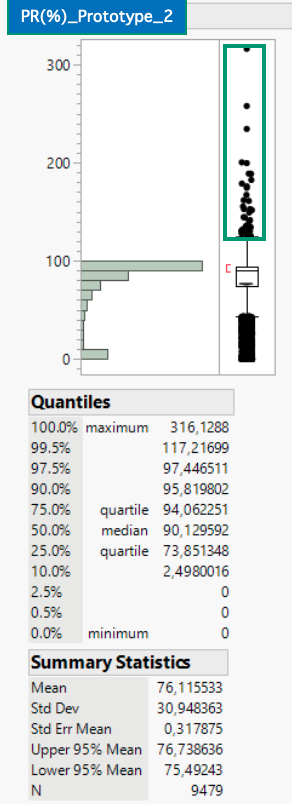
Prototype 2 has the highest median (90.13) and mean (76.12), indicating generally higher performance compared to other prototypes.
Prototype 1 has the lowest median (65.84) and mean (56.64), suggesting lower typical performance but higher variability.
The other prototypes show a very similar shape in terms of their distribution of measurements and outliers. It can be assumed that all prototypes would behave relatively the same with the same number of measurements
Variability:
Prototype 1 has the highest standard deviation (47.67), indicating the greatest variability and presence of extreme outliers.
Prototype 2 has the lowest standard deviation (30.95), suggesting more consistency and less spread in the data
The remaining prototypes also show similar behavior in this area, which would presumably become more similar with a similar number of measurements
Outliers:
Prototype 1 stands out with extreme outliers reaching up to nearly 2000, far beyond other prototypes. For further investigation this measurement of over 2000% should be excluded for a better comparability.
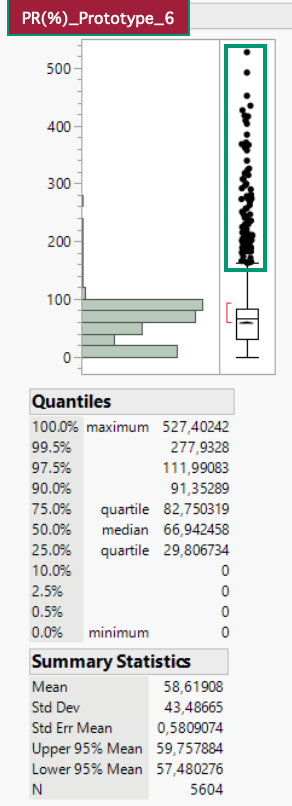
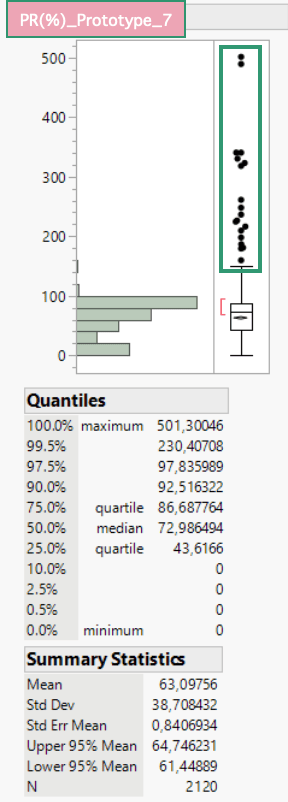
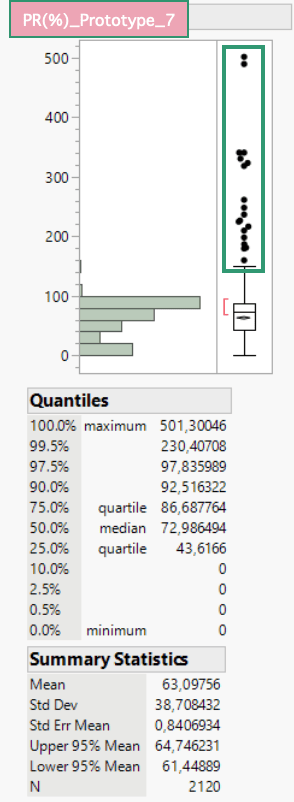
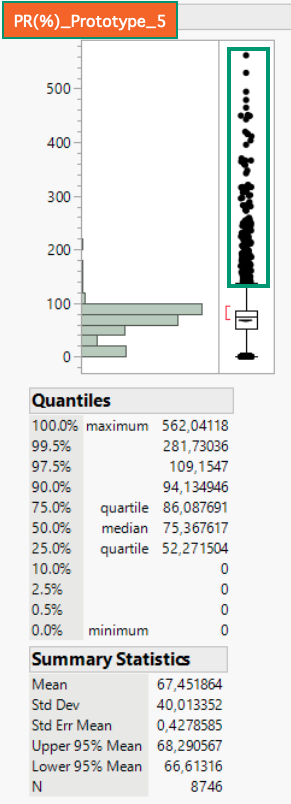
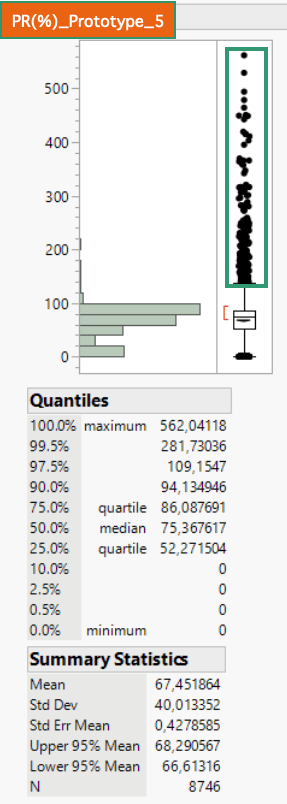
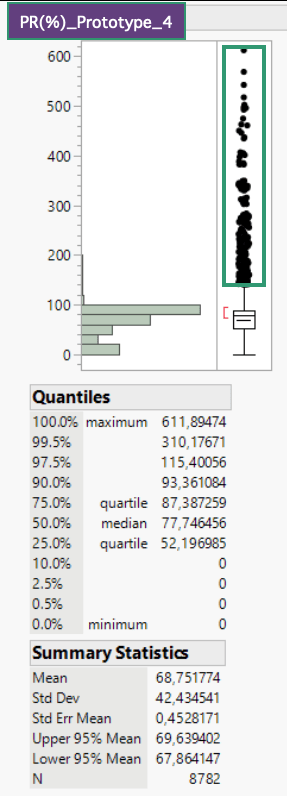
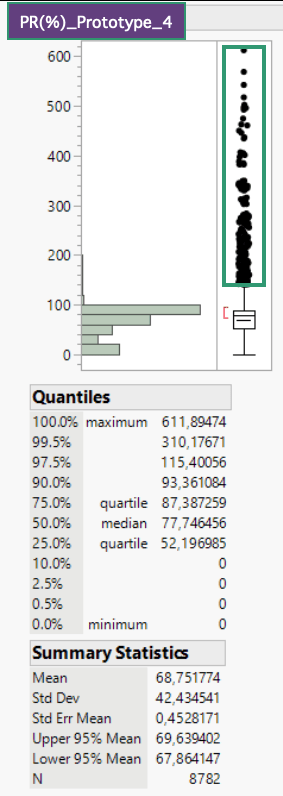
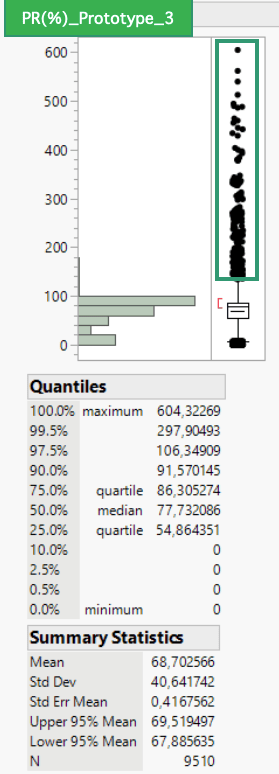
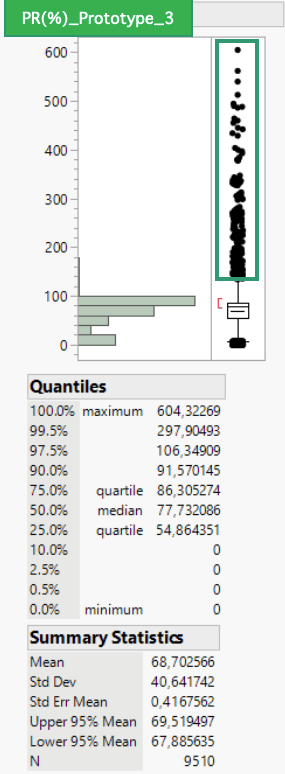
Prototypes 3, 4, 5, 6 and 7 show similar patterns, with dense clusters of outliers between 500 and 600, indicating similar data distributions.
Prototype 2 has fewer extreme outliers, with a maximum value around 316, indicating more contained variability.
Distribution Shape:
Prototypes 5, 6 have medians close to their means, suggesting symmetrical distributions.
But also the prototypes 1, 3, 4 and 7 are almost symmetrical distributed with a difference of ~9 between mean and median
Prototype 2 shows a more left skewed distribution with a mean significantly lower than the median(~14).
Conclusion
Prototype 1 is characterized by extreme outliers and high variability, making it less stable but potentially useful for understanding extreme cases.
Prototype 2 offers the highest central tendency with relatively lower variability, making it potentially more reliable for consistent performance.
The other prototypes show similar patterns, with moderate central tendencies and comparable variability, providing a balance between stability and the ability to handle outliers.
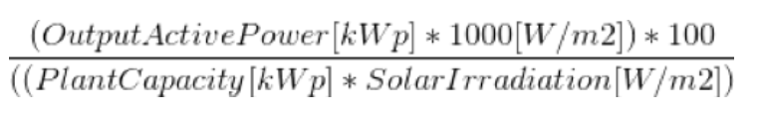
lI. Approach: examination of the PR formula
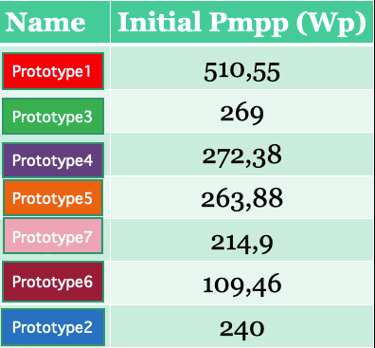
fixed values
Standard Test Conditions (STC)
fixed values
flexible values
flexible values
Question 1: Do we get outliers because of higher OutputPower (measured Wp) than PlantCapacity (Wp under STC)?
Question 2: Do we get outliers because of too high OutputPower at very low SolarIrradiation (perhaps as a result of shading/cloudy weather)?
Prototype1 Outliers
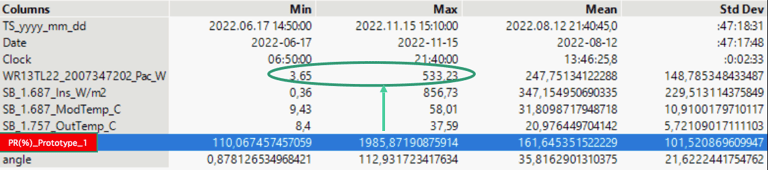
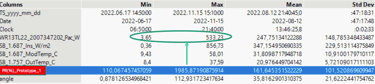
Plant capacity of Prototype1 under STC (1000 W/m²): 510,55 Wp
WR13TL22_2007347202_Pac_W ≙ measured performance in W
In the first summary, we only consider the measured power in a range of PR ≥ 110% where the maximum irradiation is 1000 W/m². It is noticeable that the measured power, with a range between 3.65 and 533.23 W, shows very high variability (also shown by StdDev of 148.79), which means that the PR outliers do not necessarily result from excessively high power. It is also important to note that with a measured irradiation of up to 856.73 W/m², a power of 533.23 W was measured, which is significantly above the capacity of 510.55 watts. It is also interesting to note that we achieved a PR ≥ 110% with irradiation values as low as 0.36 W/m². There are no noticeable anomalies in the measurements of temperatures and times of day.
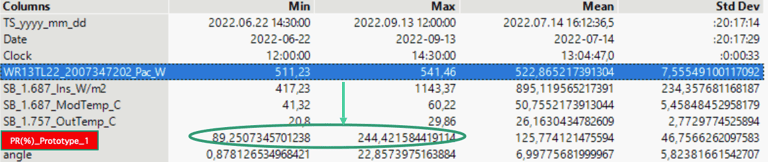
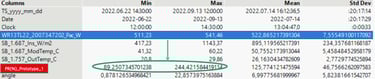
In the second summary, which only filtered for measured power values that exceed the plant capacity, it is noticeable that while outliers are present, they are not as widely spread as in the previous summary. This could be partly due to the fact that the measured irradiation, reaching up to 1143.37 W/m², is significantly above STC levels and, according to the PR formula (image9), works against the measured power. In general, the irradiation, with a range of 417.23 - 1143.37 W/m², is significantly higher than in the previous filter. Additionally, this is evident from the considerably higher module and ambient temperatures, which increase due to the higher irradiation.
Prototype2 Outliers
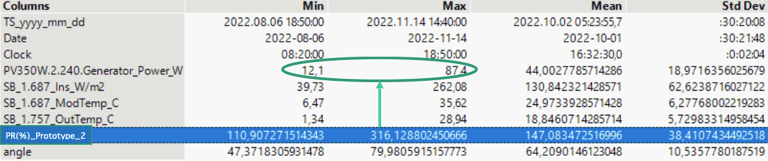
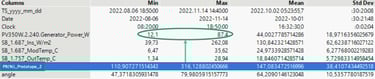
Plant capacity of Prototype2 under STC (1000 W/m²): 240 Wp
PV350W.2.240.Generator_Power_W ≙ measured performance in W
In the summary, all values occurring at PR ≥ 110% were examined. It is noticeable that the measured power, with values between 12.1 and 87.4 W, is very low compared to the total capacity of 240 Wp. Similarly, the particularly high PR's only occurred at irradiation levels between 39.73 and 262.08 W/m². Additionally, it is noteworthy that the sun's irradiation angle is very steep, ranging from 47.4° to 80°. For an inverse analysis with measured power values exceeding the actual capacity, there are no observations in this case.
Prototype3 Outliers
Plant capacity of Prototype3 under STC (1000 W/m²): 269 Wp
PV350W.2.270.Generator_Power_W ≙ measured performance in W
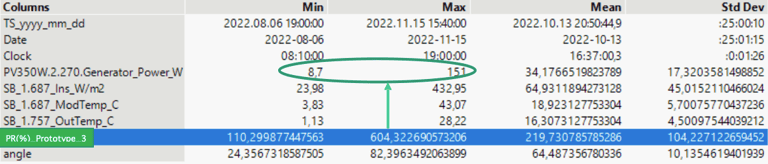
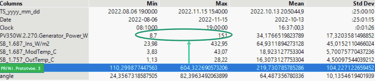
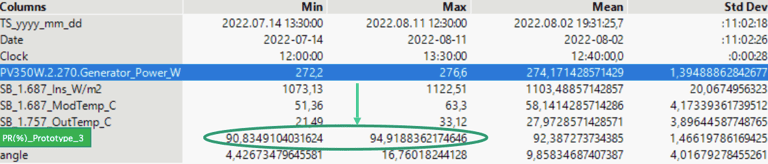
Similar to the previous summary for Prototype 2, in the summary with the filter of PR ≥ 110%, we only achieve power values between 8.7 and 151 W, which is very low in relation to the total capacity of 269 Wp. It also appears that the maximum PRs occur at very low irradiation levels, up to 432.95 W/m².
In the second summary, which was filtered for measured power values exceeding the actual maximum capacity under STC, we find PRs between 91% and 95%, which would be within expectations. Additionally, it is important to mention that all measured irradiation values are above the STC limit of 1000 W/m².
The summaries of the measurements for the other prototypes are similar to those of Prototype 3; therefore, I have not included them here. However, this does not mean that they will not play a role in the final evaluation.
Conclusion and Outlook
The various prototypes can be clustered into three groups after reviewing all the data. Prototypes 1 and 2 each form their own group based on their behavior. The remaining prototypes behaved very similarly, which is why Prototype 3 was used as a representative in the detailed outlier analysis.
A detailed investigation of the measured power values that exceed the maximum specified capacity under STC reveals that these values do not directly correlate with a significantly increased PR. For example, in Prototype 1, although there are PR outliers up to 244%, there are also much lower PR's of 89% within the same range. Similarly, the measured irradiation, which reached a maximum of 1143 W/m², definitely contributes to higher power values, as STC measurements are taken below 1000 W/m². In Prototype 2, no values higher than those specified under STC were measured. However, it is evident that very high power values are measured within a relatively low irradiation range. The same pattern is observed with Prototype 3, which represents the remaining prototypes. Here, relatively high power values are measured within a rather small irradiation range and at a relatively large angle to the sun. When examining the measured power values that exceed the maximum capacity of 1000 W/m², it is noted that no PR outliers can be found. In summary, it can be concluded that exceeding the maximum capacity, if at all, only minimally leads to outliers. This is because such occurrences are strongly associated with very high irradiation values (≥ 1000 W/m²) and often do not result in increased PR.
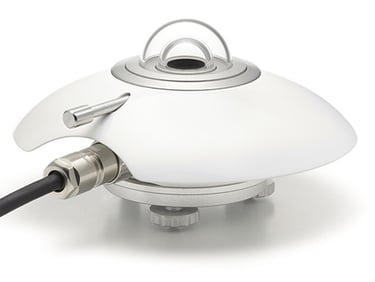
There is now an opportunity to improve future calculations with an enhanced sensor (pyranometer - image18). It is also recommended to flash the affected prototypes using matrix measurements (under different irradiation levels) to obtain results from a controlled environment that can be used for validation or falsification.
image18
There appears to be a correlation between low irradiation values and a large angle to the sun, as these anomalies consistently occur together. Therefore, it is plausible that the unusual measurements could be due to reflections from the surroundings or the irradiation of diffuse light (DHI - Diffuse Radiation - image16).
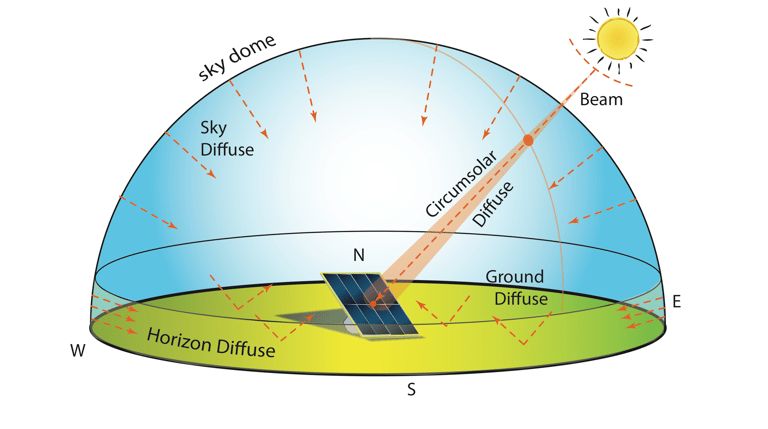
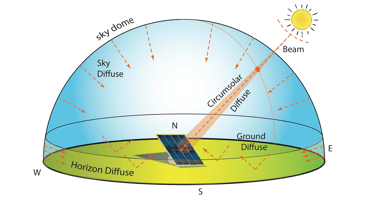
image16
image17
image9
PR in % Prototype 7
PR in % Prototype 6
PR in % Prototype 5
PR in % Prototype 4
PR in % Prototype 3
PR in % Prototype 2